OpenBIMRL | Structure
Structure (Name WIP)
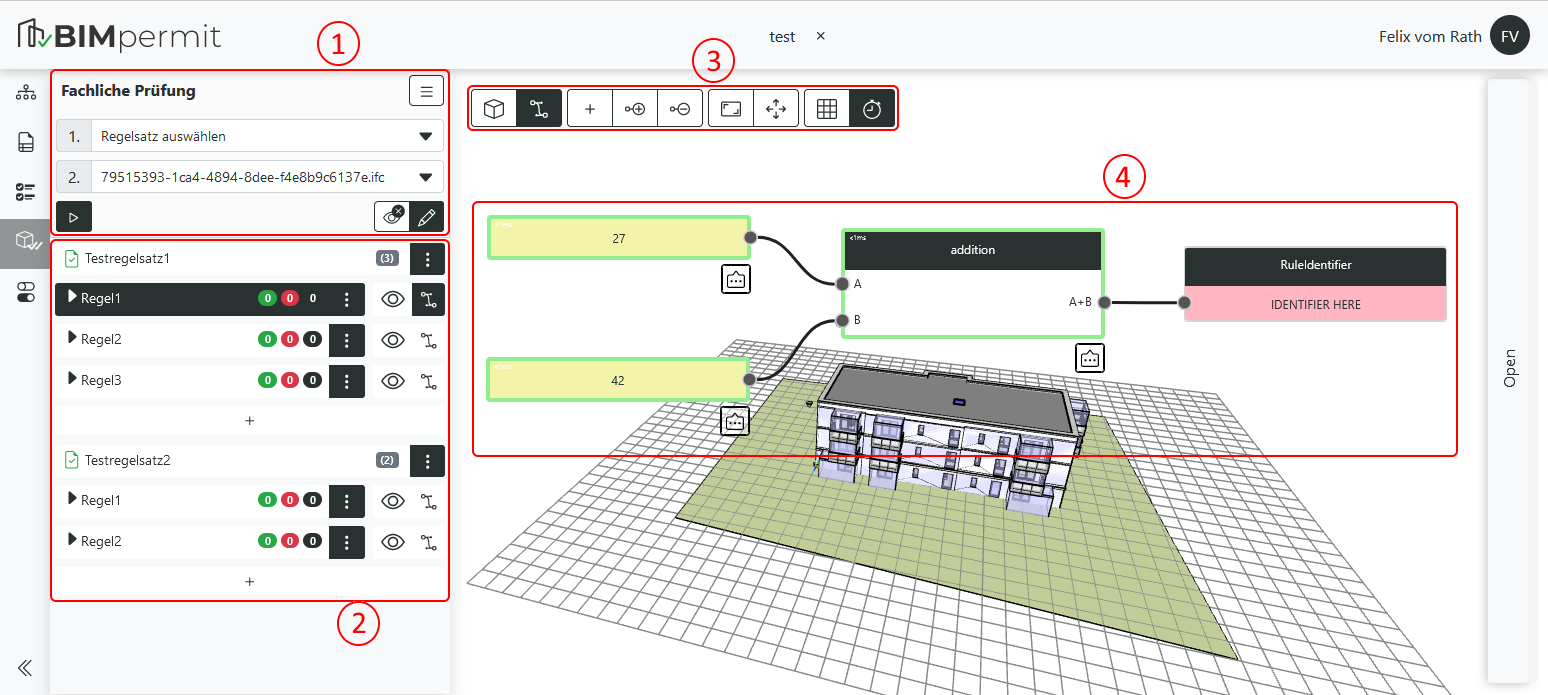
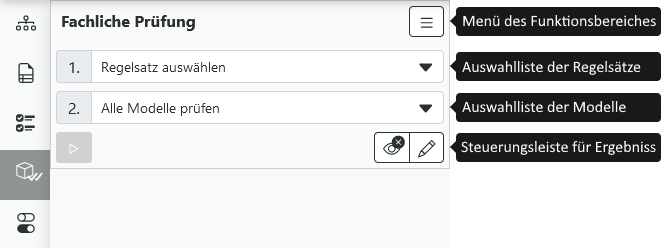
1. Perform check
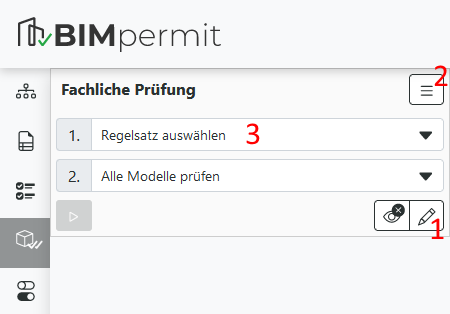
In order to perform a check, the check documents must first be configured:
-
Select rule set: At least one rule set must be selected. The quick upload of a rule set in openBIMRL format can be done directly via the view menu. The rule editor can be used to individually manage all check rules in the project.
-
Select model: Optionally, the model to be checked can be set. All models are checked as standard.
Each rule set can contain any number of rules, each of which is represented by its own graph. The check is started via the playback icon below the selection and checks all selected rule sets. After the check, the check results are listed and can be evaluated on the model.
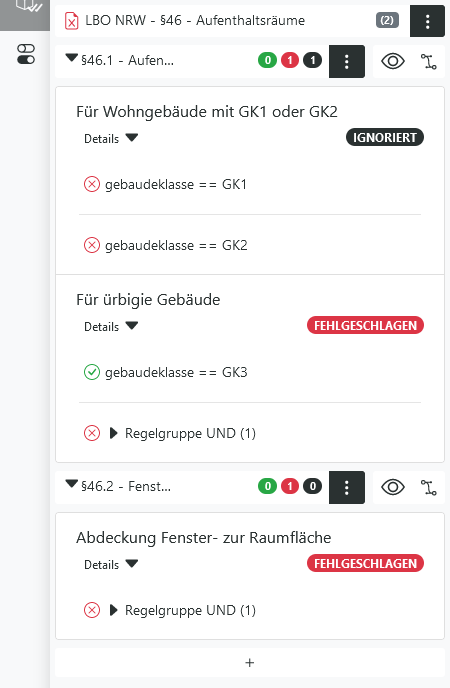
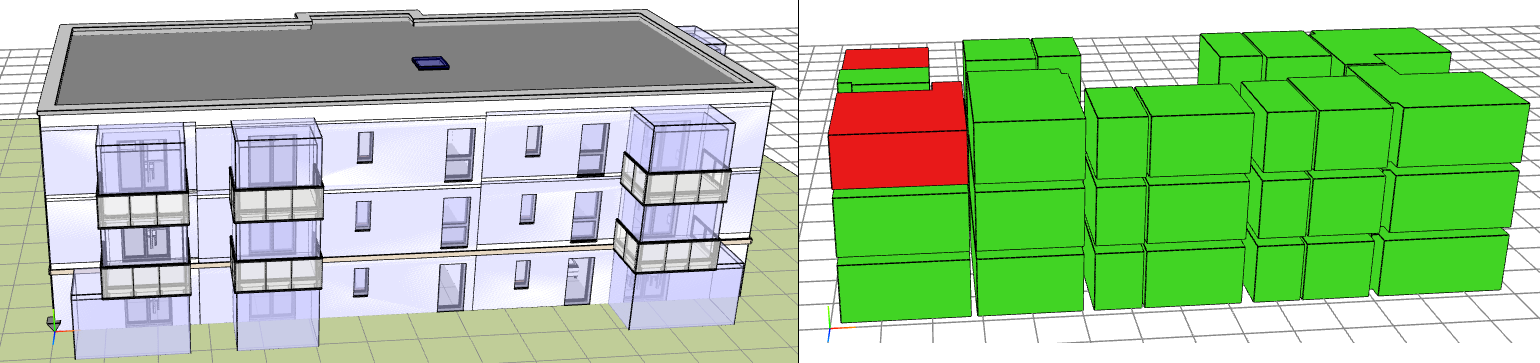
2. Evaluate check results
The output of the check results takes place in the lower area.
Rule sets can be expanded to display the individual rules and these in turn can be expanded to display check results for individual items. Via the button Details is... (nothing is displayed? except in case of success).
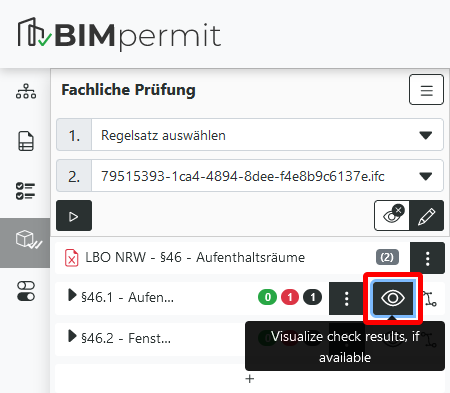
Switch on visualization
Check results can be visualized on the model. The eye symbol next to the corresponding rule is used for this purpose. In addition, the graph symbol can be used to display the corresponding graph.
3. Editor functions/ Navigation bar
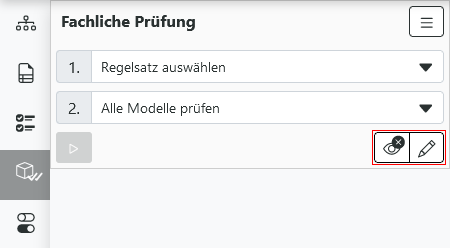
Besides the play button, there are buttons for:
- Reset view: resets the displayed highlights of a checking rule in the model.
- Edit mode: turns on the edit mode for the graph and expands the toolbar in the graph view.
The toolbar allows various editing options for the control graph.
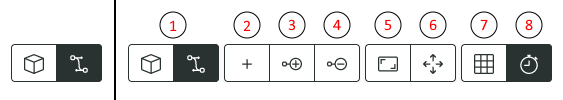
From left to right, these buttons exist in the edit mode:
- Change of focus: Toggles between interactive focus of the 3D viewer and the graph.
- Node function menu: Opens the block library in which all existing blocks are displayed in groups. The search
- bar can be used to quickly find specific blocks and add them to a rule via drag & drop.
- add to group: Adds selected nodes to a group.
- remove from group: Removes selected nodes from a group.
- rest to graph center: Resets the camera to the graph center.
- reset to canvas origin: Resets the camera to the canvas origin.
- Background grid: Turns the background grid on/off.
- Latency: Turns on/off the processing time of each node.
4. Graph view
With an openBIMRL graph, a building model can be cheked against self-defined rules using graphical programming. A graph is always read from left to right and usually starts with an input block and ends with an output block, as shown in the example below.
How do i create an openBIMRL graph?
Here, a step-by-step tutorial illustrates a small example of how to create a new graph.
- Activate the edit mode.
- Selectt Create Rule Set from the Function Area Menu
- In the Selection list of rule sets, select the newly created rule set.
- Unfold the set in the lower section.
- Click the +-Icon and enter a name.
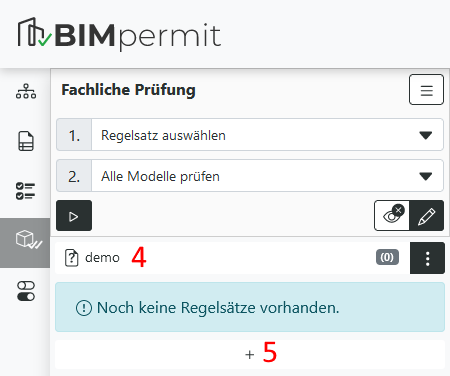
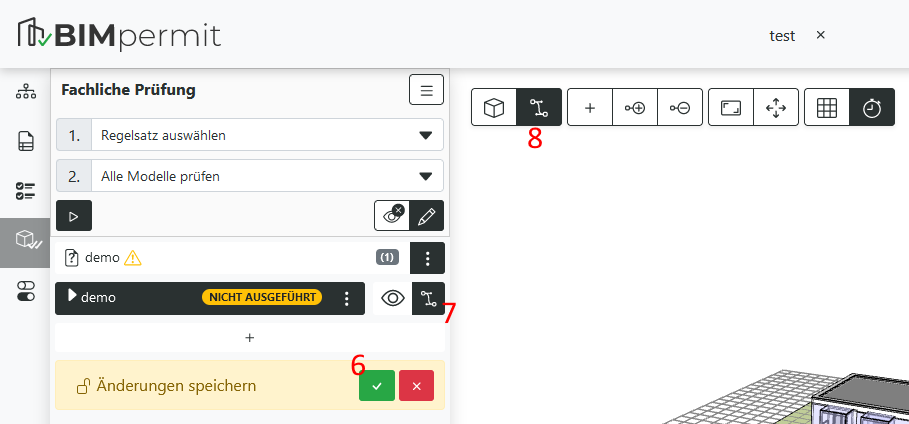
- Save the change.
- Display the graph of the rule using the corresponding button.
- Change the focus from the 3D viewer to the graph view.
Now you have already created a new graph, which will be filled with blocks in the following.
Add blocks
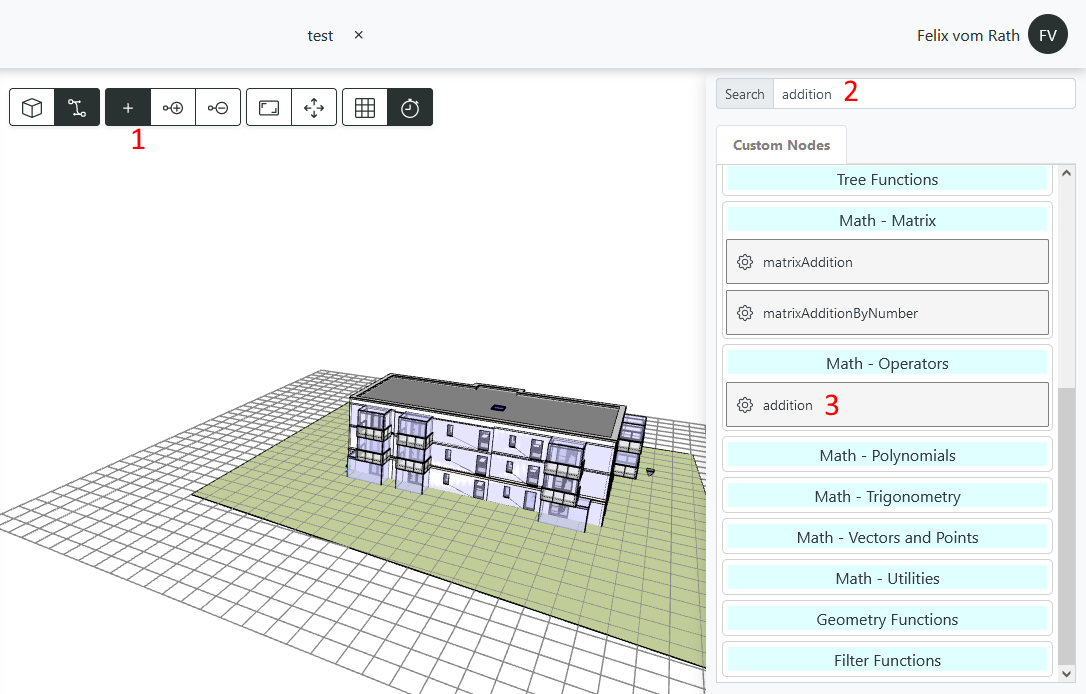
- Open the Block library.
- Search for addition.
- Drag the additions block from the Math - Operators group into the workspace.
- Search for Input.
- Drag two textInput blocks from the Input Functions group into the workspace.
- Search for Identifier
- Drag the RuleIdentifier block from the Identifiers group into the workspace.
The graph is almost complete, it just needs to be linked now and get input values.
Link blocks and enter values
- Drag an edge from each of the gray nodes of the input blocks to the two left gray nodes of the addition block.
- Connect the addition block to the RuleIdentifier block in the same way.
- Add values to the input blocks by double-clicking on each of them.
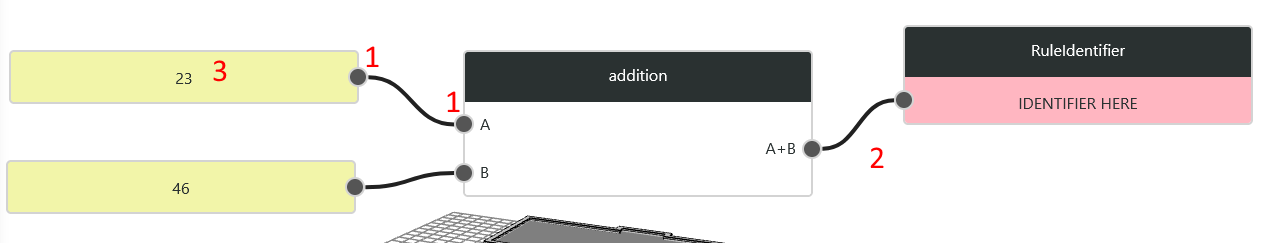
Now you have successfully created an openBIMRL graph which can be used for checking via the play button.
Use cases in an openBIMRL graph
Move in graph
The navigation in the graph is done with the mouse. You have the possibility to move the graph with the left mouse button and to zoom in or out with the mouse wheel. By clicking on blocks you select them and can drag them around in the workspace.
simple interaction with blocks
After selection a block, you can use the typical Windows shortcuts to select the node:
- copy (STRG+C)
- paste (STRG+V)
- delete (DEL)
advanced interaction with blocks
Furthermore you can:
- select a set of blocks (STRG+Links click)
- Select blocks within an area (SHIFT+DRAG)
Grouping blocks
A group can be created when a single block is selected and then the Add to group button is pressed or when multiple blocks are selected without a group.
When selecting blocks that are already in a group, all selected blocks are added to a group regardless of whether they were in a group or not. The group to add to is determined by which block was selected last.